A GUIDE TO HELP YOU Measure and present link building Results TO INTERNAL STAKEHOLDERS
My first exposure to SEO was, I believe, in 1997 – although I didn’t become familiar with the term until some time later.
And wow has it been a journey – this is an amalgamation of hard-won learnings over my professional career of 25+ years, and the parallel path Citation Labs started a few months before I began working with them.
Let’s dig in, shall we?
Here’s what we’re going to cover:
- Benefits of an outcome-driven approach when it comes time to demonstrating impact to internal stakeholders (some obvious; some, less so);
- Our own 2-year+ journey to effectively delivering reporting and analysis to our clients and how they’ve used the work in their positions
- How we recommend measuring impact for your link building projects (but much of this is tactic-agnostic and applicable to other marketing channels)
- How we suggest presenting impact – to your boss; to internal stakeholders; to clients, to your family at holiday get togethers
- A simplified spreadsheet you can add your own data to, that when used with a presentation tool of your choosing, will help you deliver the wow
TL;DR: Want to skip to gathering data and creating a report? Jump right to it.
Table of Contents
- Intro: establishing a new view into link building ROI
- Benefits of an outcome-driven approach
- Heading down the path to delivering link impact
- Measuring link impact
- In practice: guide & template for building an impact report
- Presenting link impact
Intro: establishing a new view into link building ROI
Over the past three years, Citation Labs’ monthly link impact reporting has become central to maintaining and growing our client relationships.
What used to be simply a spreadsheet full of links earned alongside target URLs has evolved into a detailed analysis of what’s happening at the SERP level for the pages we’ve built links to.
We’re still consistently building stellar links, but now we can show our clients – and they can show their bosses – exactly what impact our link building has done for their SEO program.
As our work wraps on our internal tool we decided it’s time to offer our methodology to the wider industry at large, in the interest of enabling clearer communication and learning from you where our methodology could improve.
Fundamental Concepts we hope to communicate:
- Selecting impact-worthy URLs: link gap analysis (establishing a basis for link volume, effective page selection based on business needs/resources, projecting required spend)
- Determine what’s reachable and reasonable given the strength of competitors
- Align tactics to internal goals
Benefits of an outcome-driven approach
There is no shortage of benefits here.
Ultimately, this is about why demonstrating impact is important for internal stakeholders, clients, and for you as the SEO.
This manifests in myriad ways, but here’s the short-list:
- Build trust with stakeholders to get buy-in for your priority projects
- Set yourself up for successfully delivering on goals/KPIs/OKRs, etc.
- Get promoted and lead SEO
Those are likely somewhat obvious. Let’s go a little deeper:
- Get buy-in for increased focus on link building or parlay success into other tactics based on the internal support you’ve earned by demonstrating the impact of your work and even – dare I say – tying it in to ROI (audible *gasp*)
- Funding for projects, link-building or otherwise, that will help you deliver on your personal career goals and also showcase the impact you’ve had to build up your resume (or CV for those in other parts of the world)
- Additional resources to help you do more with more – demonstrating the impact your work has had is one of the best ways to get a “yes” when asking to open a position or outsource some of your work (hint, hint)
- As an agency or contractor, this can be the difference between keeping and losing your clients
- As a FTE, this can be the difference between keeping and losing your job (top of mind for anyone? Also if you are or your employer is hiring, we have a few Friends of the Lab who have been laid off and are looking for work so please reach out)
- Earn a promotion based on your ability to demonstrate the impact your work has had on the company’s revenue-focused objectives
- Inform your seo and link building strategies based on the results you’ve seen from your data-driven and well-focused link-building (ok, or other tactic) initiatives
- Overcome and even support your stakeholder challenges – your analysis can uncover hidden opportunities that can directly benefit your stakeholders’ respective lines of business – I’m not suggesting you’ll be hoisted up on their shoulders and paraded around the office, but stranger things have happened!
- Showcase your data-driven chops and become a trusted internal resource, or share learnings with the SEO community and earn yourself a speaking engagement at an upcoming marketing conference
- Develop case studies that can be used in your career goals
- Enhance and bolster visibility around internal reporting, to make you, your boss, their boss, all look good
- Prove to yourself and your organization, clients, etc. that – news flash – links work!
This does a better job of scratching the surface, but is by no means complete. I would love to hear what benefits you see from a data-driven, impact-focused reporting and analysis of your marketing initiatives, even if it’s not about link impact explicitly.
Heading down the path to delivering link impact
The company’s journey to deliver reporting on impact has been a bit of a winding one, but the catalyst for that first step is straightforward enough:
We had a problem with client churn, and we wanted to nip it in the bud.
Earlier on in our company history, we faced a challenge: so called ‘great links’ weren’t moving any ranking needles within proximity to revenue and therefore there was no way to justify ongoing spend. There was no proof that the links did anything.
So when one of our “great links” champions moved on to a different company, the remaining team saw no actual evidence of the impact the links were having – at least not with a direct correlation. As a consequence, we’d be put on pause, often permanently.
Even when we started targeting links to sales landing pages, we still didn’t know how many links we’d need to build, or how to convey to our clients that the links were ‘working’, particularly at the earlier stages of a campaign. We knew for revenue-impact to happen, we needed links to sales pages, but without clear benchmarks or correlation to our work, we still lost clients – often for unintentionally over promising and under delivering on impact.
An early attempt in the right direction
Our first attempt at impact reporting was to begin tracking impact at the individual SERP-level. This was the right direction, but at that point we lacked an understanding of effective benchmarking, and we were also initially unsure of the data points we should track or how to display them visually. This led to more challenges, and we still came up short.
Sidebar:
This is the point at which I personally became aware of Citation Labs and started working with them as their client contact.
Key takeaways from that experience:
- I saw first-hand Citation Labs’ ability to improve rankings directly to local sales landing pages;
- Having worked with them over six months as the client, I experienced the integrity by which they operated first-hand;
- I was a recipient of the early version of the impact report;
- Seeing the correlation between links built and impact received, and feeling confident I had something to contribute that would help take reporting to the next level, I asked for a job. And here we are.
A major challenge identified: the number of links needed
One now-obvious challenge with link building, one that is not covered or focused on nearly enough: gauging the link volume required to drive improved rankings to high-converting pages. In a word: impact.
Historically, we had a wait-and-see approach to the number of links needed to move the needle. This resulted in gross ineffectiveness on both sides.
Either we:
Picked a page with too large of a link gap relative to the client’s budget and spent resources that wouldn’t drive impact;
OR
We built more links than were genuinely needed, and achieved results but at too high of a cost.
Other challenges complicated things as well
New clients recognized they needed link building, but were often not prepared with a list of pages to include in the campaign (part of that is based on our approach, part of it is the ambiguity and lack of transparency around link building).
This necessitated waiting for clients to tell us which pages to build links to and how many – we expected them to somehow know – and then left them holding the “blame bag” if things didn’t work out. Though SEOs know a great deal about links and link building, we had to step up to be the leader in regards to link volume assessment, and deliver reporting that highlighted impact.
In the absence of anything more effective, clients overvalued the Domain Authority of the linking site (the trees) and undervalued the impact backlinks could have on kw rankings for target sales pages (the forest). Relevance signals outweigh authority signals, though – outside of link impact tracking – this is difficult to measure.
Another challenge, especially at the enterprise level: clients are usually unable to provide an on-domain email address. This eliminates a number of tactics with notably higher success rates.
Impact reporting: progress update
We’ve spent the past couple of years developing our internal reporting tool, and have learned much along the way. The focus of our internal tool, from the beginning, has been squarely on the theme of this article: to demonstrate the impact of link building for our clients and their internal stakeholders.
And we’ve seen great success. Client churn has dropped dramatically, and we’ve received very positive feedback regarding the usefulness of the reports. And with our measurement over time against a control group of similar pages, we’ve been able to very clearly demonstrate that – news flash – links work! Yes, still. Yes, today. Yes, across numerous clients and over an extended period.
And while the tool itself isn’t ready to be shared (we hope to get there in 2023), we want to at least share this outline for how you can get these benefits yourself by building a similar view in a spreadsheet and putting your own polish on it in slides or a PDF, etc.
Here’s an update on our progress of building the tool.
What we’ve done so far
After lengthy research and testing, we’ve recently launched v2 of our internal impact reporting tool.
A focused, simplified reporting tool with the goal of correlating the work completed to the impact the subject pages are seeing.
What we’re measuring and & we didn’t just subscribe to an existing reporting tool
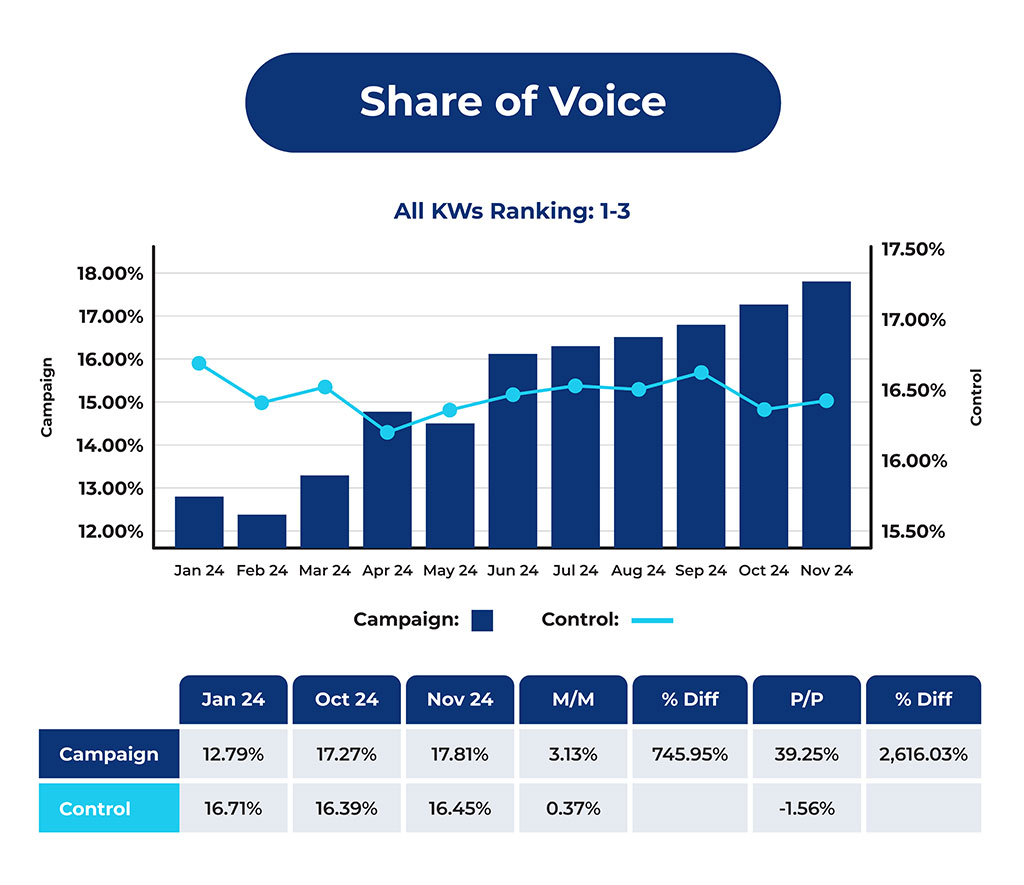
Our focus is primarily on keyword rankings –
- looking at rank by distribution,
- average values,
- segmented in various ways (KWs ranking in positions 1-3 or 1-10; top 10/25/50 by search volume; all tracked rankings),
- also using share of voice as a proxy for traffic,
- displaying the progress of the campaign in terms of links earned,
- using 3rd party metrics such as Page Authority,
All pretty familiar stuff to you I’m sure.
Why didn’t we just sign up for a SaaS reporting tool?
One important addition to the above, and one of the reasons we didn’t simply sign up for an existing SaaS reporting tool or create custom reports in GA or Google Data Studio, is our use of control group to tie things together so we can identify external factors like core algo updates, to show a higher correlation between links earned and impact seen. We just couldn’t quite get the right view of all of the above in our early attempts to use an existing tool.
As we were wrestling with the age-old ‘buy vs. build’ question, we found a lot of reporting tools out there with all kinds of bells and whistles. Many of them – like Google Data Studio – are even supported by plug-ins and data connectors that allow you to pipe-in data from GSC, GA, and probably all of your favorite SEO tools. They allow for a high degree of customization and even allow you to merge datasets, like Data Studios’ infamous ‘blended data’ feature.
We found two big challenges with a lot of them: A) it’s pretty tricky (though not impossible) to get them to overlay a control group against the test group (A/B testing-style), and B) in an effort to build in every possible feature for every conceivable application or use, they often de-priorized outcome – the very thing we were trying to measure and highlight for our clients.
Those weren’t the only issues – a number of other challenges reared their heads, such as how we make a change to a report and update it across all clients (please @ me about this article, but I hope you do it to provide feedback instead of letting me know this is actually possible in a number of tools, as I’ve seen since our initial research), full feature-level access control for those signing in, and more.
Also – #SpoilerAlert – we’re so excited about our internal tool that we plan to introduce it for use into the market at some point in the future, so we are committed to building.
We’re now going to switch gears and focus on our methodology for approaching the two most important aspects of demonstrating link impact:
- Measuring impact
- Presenting impact
Measuring link impact
There are a lot of report styles out there. A LOT. I’ve built many reports in spreadsheets (including early versions of ours), in Google Data Studio, custom reports in GA, and I’ve used a number of other tools as well.
They’re all different; they all have different metrics, graphs and other visuals, customization of one form or another and much more.
And while this uber-flexibility may seem desirable on the surface, it sometimes can lead us in the wrong direction completely.
As we were building our reporting tool, we wanted to balance a number of things, not the least among them being the balance between choosing metrics and segments that would highlight impact, without making the report so heavy that all the metrics became a distraction.
To keep us on track, we were intentional with the chosen metrics. We prioritized rank-related metrics because our goal was to showcase the impact we are having in SERPs for each client, for – and I’m about to use some vulgar language here so be forewarned – their keywords.
We look at keyword rankings a number of ways: based on their distribution into various buckets (positions 1-3, 10 or better, 20 or better, a number of top X keywords, priority KWs, total ranking KW count, etc.), as well as creating a mechanism to allow exclusions in order to separate brand traffic, and the various and sundry undesirable KWs a page will inevitably rank for without the the intention to do so.
We have also incorporated share of voice – a weighted visibility score that factors in rank-driven CTR values and search volume. This provides additional flexibility and helps not create issues that often come up if we report on estimated traffic and that gets compared to internal ‘actual’ traffic. The last thing we want to do is distract from the awesome impact our links are having by getting a higher-up stuck on the disparity between the traffic we’re estimating in our report and true traffic being reported internally.
One element of impact reporting that is extra challenging when it comes to rank and search results: showing early movement. We typically see two early indicators that our links are having an impact in the first few months of an engagement, before rank and visibility start to move: 1) the total number of ranking keywords increases; 2) the other one is Moz Page Authority – PA will pick up on the new links and increase the PA value typically long before we see ranking improvements. So we rely on these metrics pretty heavily in the early months of a campaign.
Now that we have an idea of the metrics we use and how we slice them up, what do we do with that information?
For our reports, we pull in a decent amount of data – typically tracking up to 1K keywords per page in the campaign, as well as a control group similar to the campaign group.
A/B testing – comparative analysis
One element we found challenging when using 3rd party tools is comparative analysis – at least the way we wanted to do it.
It’s relatively straightforward to compare different time frames (as long as they’re comparable, which is not always that easy to do with seasonality etc.).
What turned out to be not-so-straightforward was comparing one set of pages and keywords against another set of pages and keywords and account for the differences between them, this proved to be challenging in any sort of streamlined way as we were working through potential ‘buy’ options, and because this feature was paramount in our plans to measure the impact of links we built, we needed a solution.
The lack of A/B testing in SEO is not without irony. Essentially everything we do in SEO is one form of a test or another:
- Creating a structured internal linking program is testing whether passing ‘link equity’ to the pages we want to rank will improve their rankings.
- Addressing technical issues on our site is testing whether those issues were throttling our pages’ performance.
- Creating content targeting a particular topic or group of keywords tests our site’s ability to rank for those phrases.
Yep – all tests. Not easily measurable ones in terms of the specific changes, but still all tests.
So by the nature of what we do, SEOs are constantly testing. But running those tests effectively – and m-e-a-s-u-r-i-n-g the outcome of those tests – is with only a few exceptions, not something the SEO community consistently promotes, creates tools for, measures effectively or presents to stakeholders, bosses, or clients. We’re stuck in this cycle of making changes based on best practices or our own assumptions or someone’s case study, and we probably change too many things at once with no effective A/B or multivariate testing and measuring methodology.
We didn’t want to fall into this trap because we were already struggling to know whether the links we were building were having any impact.
Our solution to this has been a game changer. Comparing the visibility we’re seeing across tracked metrics and segments for our campaign pages against a set of similar control pages has helped us identify and speak to external factors (read: the spate of Google algorithm updates over the past several months) and dis-associate site-wide changes from the changes we’re seeing on the campaign pages.
Correlation to impact
This one is tricky. We all want to think that SEO tactic X will immediately have an impact on performance, just like a change to the copy in a Google ad for a highly-searched query can immediately improve ROAS. Like, the same hour.
With SEO, it could be a week. Or a month, or longer depending on myriad factors. For link-building, the time from link(s) built to keyword ranking impact seen is probably more like 4 months, give or take, while a few other signals (ranking keyword count, 3rd party metrics like Moz PA) often show movement earlier on in the timeline.
Possible reasons for this may include the ‘Google sandbox effect’, where there’s been pretty clear evidence that a deployed SEO tactic often seems to have a programmed delay (whether intentional or coincidental); it may relate to the time it takes once a link is built for Google to crawl the referring page, crawl the destination page, index both (maybe one site relies heavily on JS and we must wait for queue’d rendering), and both pages have to be analyzed by SpamBrain, etc. etc.
Whatever the reason, we see this time and again – both with new campaign kick-offs and also during pivots down the road, and on sites big and small, whether the pages are crawled by Google daily or bi-weekly. There’s a lag between a link built and the impact recorded, often in the 3-4 month range.
One unexpected way this manifests itself early on is through an unexpected but consistent event I’ve already mentioned: the number of keywords grows faster on pages that have earned new links, compared to pages that are not part of the campaign.
We realized this because as we started consistently reporting on our campaigns, we noticed that early on (first 1-3 months), the average rank for the keywords we started tracking would actually worsen for sometimes a couple months or more, before ranking then started improving.
Digging in to attempt to find the cause, we discovered substantial growth in the number of ranking keywords. And the pace of this growth was far greater than on control pages that we were not earning new links for. In time, this growth in ranking keywords would normalize and rankings would begin to improve.
And it honestly makes perfect sense: when new keywords start ranking on a page, naturally they don’t show up in position 3, they show up on page 3. Or page 7 or beyond. And then they begin improving.
This realization has calmed many-a-nerve for new clients kicking off a campaign.
Going down the rabbit holes – selectively
Any SEO who hasn’t spent hours, days, maybe weeks – going down a rabbit hole only to return to the surface without any actionable insights, is either a bonafide data scientist, or is probably pretty new to SEO.
It’s easy to get lost or turned around when trying to understand the reason behind a particular event, direction or trend. But digging into the numbers is also a critical element to SEO analysis.
Answering the “why”
It’s egregiously over-simplified, but I’m going to go out on a limb here and suggest that answering the “why” is the difference between delivering a report, and providing an analysis.
Without the “why”, any commentary added to a report is just a plain text version of what the data is already showing us in tables and graphs. Simply stating “we’re seeing a 12% increase M/M” directly above or beneath a table that clearly displays the 12% increase in the column labeled M/M and calling that an analysis is doing yourself a disservice.
Selectively, we’ve got to go down the rabbit holes. Give yourself a time limit; pick your battles; ask for help. Find a way to manage it so it’s not unmanageable.
But you gotta do it.
So as you’re working through another month of data, ask yourself: Why? Why is this number going up or down?
Reporting on priorities
As good as we might be at ‘managing up’, we are still going to have those higher-ups, internal stakeholders, clients, etc. who will fixate on a particular, fill in the blank. For SEO, it’s often a particular head keyword term – mixed or unclear intent, lower conversion rate and all.
While there certainly is an art to creating the right narrative and positioning around addressing these sorts of off-focus fixations (a recurring theme in Tom Critchlow’s SEO MBA course content), at the end of the day, there may be no way around all of them.
And for non-executive purposes, we may have a legitimate need to report on specific keywords.
There’s a solution here: create a priority keyword group and report on (and analyze them) separately.
When we added this capability to our reporting tool, it made a huge difference. Yes you probably have them labeled in your rank tracking tool or spreadsheet, but that doesn’t mean they are easily flowing into your reports (and if they are, good job, we’re with you on this).
We use the priority segment pretty extensively. The benefit is I can speak to performance explicitly for this group of keywords, while focusing on the bigger picture as well. It essentially enables me to meet the requirement of reporting specifically on these high-visibility keywords, while also showcasing performance more broadly.
Two things SEOs Seem to Avoid: 1. keyword rank; 2: __ __ __
If you thought ROI, you’re correct. And hopefully you didn’t break out into a cold sweat while thinking it.
Here’s the thing: literally every other marketing channel is going to forecast ROI. Why? Because they can justify the spend and ask for the bigger budgets they know they’ll need to be successful.
So it’s time for SEOs to stop avoiding ROI. Just put it out there. Use it to make your case. Analyze why (there it is) you missed it if you miss it, and run more tests next time.
It’s not even that difficult of a calculation, and you have everything you need to know a few clicks away from this page, in order to calculate it:
- Your average order value (AOV) or your customer lifetime value (CLTV)
- Your CTR, CVR
- Your costs – this is a little trickier, but not actually tricky. Make assumptions and disclose them. If they get challenged, revise them.
A hint from paid search’s ROAS modeling
Paid search has this great metric: ROAS. Return On Ad Spend. If you dig into it, it’s brilliantly straight forward: you want your ad to generate more revenue than it costs. So if the cost-per-click is $25, you want your revenue per visit to be higher than that. It’s expressed in different ways, but a 4:1 ratio ($4 earned for every $1 spent) would be an awesome ROAS. For highly competitive spaces, an acceptable ROAS might be 1.4 (or 1.4:1, or 1.4 to 1), meaning for every $1 spent, you make $1.40.
The key with the ROAS model: not all costs associated with running a paid search campaign are included in the ROAS calculation.
For example, fees paid to manage the campaign – even if management is being handled by a 3rd party vendor or agency – are not included. Costs for developing assets etc. is also not included.
Typically it’s just the hard cost of the actual click charged by Google, Facebook, etc., which makes ROAS a pretty straight forward calculation. Here’s a simplified breakdown:
- Establish the cost per click, let’s use the example of $20/click
- Establish the conversion rate from the paid campaigns, let’s assume it’s 5%
- Determine the revenue per conversion, let’s assume that’s $1,000
Now we calculate our Return On Ad Spend on 100 clicks to our site:
- We pay $25 for each click, so our ad cost is $2,500
- At a 5% conversion rate, we get 5 conversions every 100 clicks
- Our revenue/conversion is $1K, so for 5 conversions, we earn $5K
- Our revenue generated is $5K, and our click cost is $2,500, so our ROAS is 2:1
How could we use a similar model to show the cost/visit for organic search? Glad you asked :)
- Find out what the value of a conversion is for your company
- Now use that value and your site’s conversion rate to determine how many visits you need in order to get a web conversion.
- Use your SERP click through rate for your current rank to estimate current conversions if you don’t have the actual organic conversions, and then you can determine your current value per visit.
- Now use the CTR for the rank you hope to achieve from your SEO initiatives (we use CTR modeling from Advanced Web Rankings), and you can calculate what the conversions and revenue will be once you achieve that rank.
- Build in a buffer (it’ll take time to get from your current rank to your target rank), and you now have an estimate of what your revenue will be if you are successful.
- The other element of the ROI calculation is cost – make an estimate here of how much time you’ll need to achieve results if you’re doing the work on your own, or if you’re outsourcing that work – even better – just plug those costs in.
You don’t need to account for everything – other channels are just going to use their hard costs in these calculations, not the soft costs of their time to implement the work.
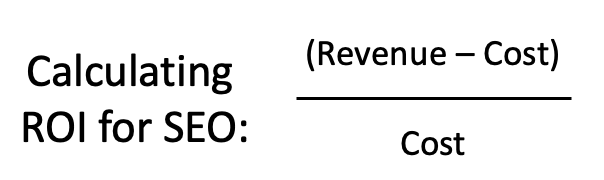
How do you project ROI? (Estimate of revenue from improved rank minus cost) divided by cost.
Now this next part is really important, because it’s THE BIGGEST ADVANTAGE SEO HAS over most other channels: forecast this revenue out over time and keep a running tally of the amount. For the other channels, once they shut off the spend, the benefit goes away. Ads immediately stop appearing in search or on TV, for example. Your costs will stop (or be dramatically reduced to maintain your rankings) but the clicks and revenue will keep coming until one of your competitors out-ranks you.
As an example, let’s imagine you have a page you want to improve rankings on. Currently you average position 12 for the top 50 keywords, which cumulatively have a total monthly search volume 20K searches/month. Your SERP typically has a featured snippet, videos, and organic results, resulting in 85.3% of clicks going to organic rankings, per AWR.
Let’s assume your revenue per conversion is $500.
In this scenario, you would expect to get 0.88% of the clicks from those 20K searches, so the current rank of 12 would bring in 176 clicks/month.
If your CVR for that page is 1.5% (assuming this is a sales landing page and not a blog post), the revenue generated/month from your current rankings would be 2.64 conversions. Multiply that by your revenue per conversion of $500, and this page is generating $1,320 per month from organic traffic.
That’s your baseline. Subtract this out of your forecast so your ROI is net-new revenue, not including anything the page would have earned on its own based on baseline rankings.
Now assume you estimate a cost of $10K between your time and outsourcing (do some off-site content generation to earn backlinks, have content rewritten for the page, get a graphic designer to build a high-impact infographic, optimize the heck out of the page, find a handful of internal pages the are relevant and build internal links), and project you’ll get to an average rank of position 4.
For a rank of 4th, the CTR (per AWR) is 5.65%. For those 20K searches, you’ll now earn 1,130 clicks, and at your CVR of 1.5% you’ll get 17 conversions for a total revenue of $8,500.
Well, raspberries – you didn’t make more than $10K, so you’re at a negative ROI, right?
Sure – if you’re working in PAID search. But you’re SEO – your cost has now ended, you achieved your rank of position 4, and you’ll keep reaping the benefits until another site takes away your position (or until Google does away with pagination and we have to re-calculate CTRs, we’ll see how that fleshes out, but I digress).
So you have a one-time cost of $10K, and you now will be earning $8,475 PER MONTH from your efforts. Assuming it took you 4 months to go from position 12 to position 4, project your ROI for those extra two months where you’re at the new position, back out your previous revenue (1,320/month) for an adjusted residual revenue of $7,155/month. You’ll have a positive ROI in month 5 and it’ll be all smooth sailing from there.
Here’s a visual to drive it home:
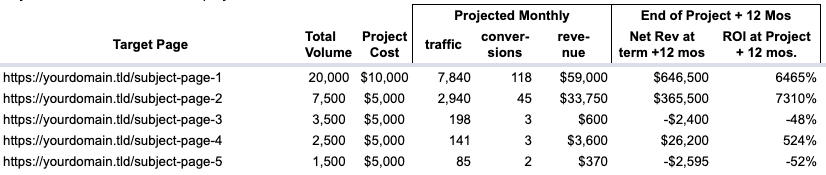
(ROI forecasting calculator in the report template – HubSpot’s ROI calculator is great if you’re looking for something more robust)
The K.I.S.S. method – applied to impact reporting
As I mentioned before, the number of whiz-bang reporting tools out there is eclipsed only by the number of misleading, ineffectual and far-too-long-to-be-useful reports that have been generated using them (through no fault of the reporting tools, or the person creating them).
And have we seen some doozies. Chart after chart, page after Mother-of-SEO-please-let-this-report-be-over page, often completely devoid of any written commentary to help the presentee understand the data they’re probably seeing for the very first time, and we (oh yes, I’m guilty of this too) end up delivering reports that are essentially non-actionable. No clear outcome. No “why” on the numbers.
There are two elements to solving for this:
- Having an impact-focused report that effectively shows performance as concisely as possible; and
- Adding analysis commentary that digs into the “why” and effectively explains what we found at the bottom of those rabbit holes.
In practice: guide & template for building an impact report
(Data from SEMRush, using Microsoft Excel or Google Sheets)
Now that we’ve discussed what we consider to be the ideal approach to measuring link impact (and more broadly, impact from any initiative the is designed to improve search engine rankings), let’s talk about what compiling that data looks like.
Items needed:
- The appropriate data from a source of your choosing (we’re using SEMR data but data from any source will do)
- A spreadsheet for pivots, calculations and charts
Here’s a Google Sheets template (make a copy to add your data); if your company IT guidelines don’t allow you to access Google Sheets, please message us and we’ll send you an Excel version – full disclosure: it’s a bit laggy)
The spreadsheet is data-source-agnostic, so any source that can give you this information will of course do. We pull the data in via API calls from SEMRush and Moz to blend with internal data depending on the particular report or tool, but to keep things simple, I’m just using SEMR data for this guide.
Here are the steps to get the data for your URLs into the spreadsheet, using SEMRush (other sources may have different steps, but the goal is to get the same set of data into the report, regardless of the source):
- Gather data from your chosen source, in a way that aligns with the data in the Data tab. For SEMR:
- Run the Organic Research report for your URL
- Select “Exact URL” at the top to see data only for that URL, not for the subfolder, etc
- Switch to the Positions tab to export KW rankings positions across KWs SEMR tracks for this page
- Set the ‘Date’ selector at the top for the first month in your report
- Export the data for the number of KWs you want to track – be consistent with this value for each page
- After you have exported the data, open the file, add 2 columns: one for Date (based on the month of data exported), and one for Campaign/Control (to designate which grouping the current page will belong to)
- Repeat steps 1 and 2 for each month you want to include in your report (change date & export, change date & export, etc.) for each URL
- SEMR’s Page Authority Score can be found on the Domain Overview tab in SEMRush (be sure “Exact URL” is chosen at the top in order to see Page Authority Score), and use the date selector at the top to get the value for each month – repeat the value in each row of data for that URL and month
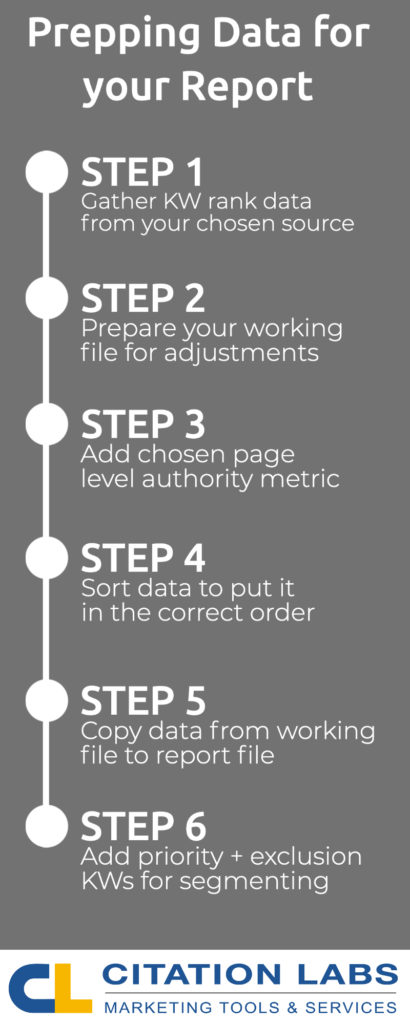
- Once you have adjusted the layout of the exported data so it matches the layout of the Data tab of this spreadsheet (by removing unused columns and re-ordering the remaining ones to match this sheet’s layout), let’s make sure it’s sorted in the right order for the formulas to process. Select the data in your working sheet, and:
- Added: A to Z (or oldest to newest)
- url_type: A to Z
- url: A to Z
- search volume: Largest to Smallest
- After columns have been mapped to the same order, the additional columns have been added and the data is sorted properly, we’re now ready to copy the data into the data tab.
- Once the data has been loaded into this spreadsheet, you can set priority and exclusion keywords in the “Priority & Exclusion KWs” tab
- There is a “Priority” segment for the top-level metrics (SoV, Avg. Rank, Rank Distro) that relies on these priority KWS – remember to set them for your campaign and your control pages
- Exclusions: remove keywords containing certain phrases: your brand terms, competitor brands, top-funnel KWs, other undesirable KWs with mixed intent, non-relevance, etc
- You can review matches in the Data tab by filtering on the separate columns for priorities and exclusions.
Presenting link impact
Wherein the rubber meets the road.
We now have a solid report outlined. We’ve started or completed our test, eg we implemented SEO stuff – in our case we built links.
Hopefully we’ve structured our test in such a way that we’re only ‘testing’ (read: changing) a single page element or implementing a single tactic.
Our ROI is projected out to a reasonable timeline, we have re-emerged from our rabbit holes with a solid foundation on the “why”, and have charted our impact – we’re now ready to present the impact we’ve identified.
A quick word about ‘the central question’.
There is a concept, a methodology, introduced in the book “Answering the Central Question: How Science Reveals the Keys to Success in Life, Love, and Leadership” (Amazon link) written by Peter Demarest and Harvey Schoof, that introduces the concept of a central question as a solution to personal professional development.
The question is:
“What choice can I make and action can I take, in this moment, to create the greatest net value?”
One element of this, which was lost on me when I first read it, is that this question can apply to someone else as much as it can apply to me.
In other words, we can append the central question with: what choice can I make and action can I take, in this moment, to create the greatest net value – for my boss?
The idea is, if we can present impact from the lens of what will be most meaningful for our audience (especially if we keep this in mind when setting up our plan in the first place), we can help them see the value in a new light – even if they haven’t acknowledged the question we’re answering.
Your immediate answer to this question may seem pretty straightforward: you want to produce more revenue from organic search.
But I would challenge this a bit and suggest you weigh the question from multiple perspectives, because it may be more nuanced:
- Specific priority keywords the C-Suite focuses on;
- Positive short-term ROI since they’re ‘playing the long game’ with other tactics.
- As many more as you can think of
And maybe part of that central question is presenting the impact in a way that can be immediately usable for your stakeholder or boss to utilize in a different presentation – their proposed annual budget for the next FY.
What I’m suggesting is that by understanding the central question our stakeholder has, we can proactively address and solve for that question without explicitly being asked, and factor their central question into our test, reporting, and therefore, our presentation.
Shifting the conversation and earning your place around the decision table
One element of SEO that is particularly challenging for many is discussions regarding SEO with executive-level leadership. They often know just enough SEO to seem to others that they know what they’re talking about. Combined with the additional confidence an executive team member typically exudes, and well-meaning-yet-contrarian executive may talk circles around the SEO. Even if the executive is completely wrong.
This is often considered a high-risk scenario for the SEO Manager who gets called into a meeting to explain a dip in organic traffic, a drop in conversions, or to present findings from an approved SEO initiative they’ve wrapped up.
One benefit you’ll have if you are measuring impact in the same or a somewhat similar way as outlined here: you’ll have a head start in terms of presenting that impact.
‘Managing up’ and a few other prerequisites to presenting link impact
Prologue
Managing up is a key area of performance when it comes to presenting link impact and it starts long before you begin prepping for your presentation, and well in advance of actually measuring said impact.
Before we get into the primary components of managing up in your team or organization in terms of the presentation of impact itself, there are a few noteworthy items that deserve to be mentioned:
- Sticking deadlines and expectations: SEOs come from all backgrounds – if your path involved experience with project management, this one is probably a little easier for you. Managing up involves a fair quotient of established trust. This might be assumed when you first land a role since you presumably surpassed competition to be in the role; over time, the assumed trust needs to be converted into earned trust, and one of the most effective ways is through your day-to-day performance in these areas. Developing the ‘why’ is very helpful here (and often more difficult when things don’t go as expected).
- Presenting data upfront that supports your assumptions: Another challenge of SEO is at some level in your organization, you’re going to have more SEO expertise than someone in a higher position than you, whether they acknowledge it or not. To avoid a ‘difference of opinion’ – which they will almost always win, especially in an open presentation environment – the key is to support early theories or hypotheses by either building your own case studies or referencing others. An alternative to a full-blown case study would be referencing best practices documented by others and using this reference early on in your pitch for handling the project you’re measuring the impact from, as well reiterating these when making the presentation.
3 Key elements to managing up
In addition to these foundational elements, there are 3 related but distinct elements involved in managing up: data analysis, storytelling, and messaging.
- Data analysis. There’s a big difference between a) the regurgitation into text form of the numbers of a comparison of differences expressed in a calculation, and b) additional insights related to those numbers that approaches the ‘why’. This forms the basis of the next element.
- Storytelling. Once we have an indication of why a test did or did not produce the impact that was anticipated, we’re able to form a story around it. I’m referring to storytelling in a traditional sense – introduction, plot twist, conflict, resolution, conclusion (or any similar format that resonates with you). The story arc. Start with summarizing the details of the approved test, share findings, present impact, deliver the ‘why’ from your data analysis, and wrap it up by tying in the central question, key learnings, and next steps.
- Messaging. Yes, very related to storytelling, but deserving of a separate call-out. This is about how you frame up the initial scope of the project, reiterate its status as a test to see if a particular best practice will work for your site or whether the case study you relied on to justify this work was true for your environment as well. Talk about your personal effort, but make it about running a successful test, aligning the work with established best practices or case studies, framing it as a data-informed test and not a promise of specific results.
The benefit of these elements is it puts you in a proactive position instead of a defensive one. A test is just that – this particular effort did or didn’t yield the anticipated results. It’s not a reflection on you, it’s an indication that the ‘vein of gold’ you’re seeking wasn’t uncovered in this particular location. Congratulations! You’ve just moved closer to discovering it, and it’s time to go back to the data, eliminate this particular area as an opportunity for growth, and identify the next best option. Process of elimination can be just as beneficial to the company as a correct upfront guess. It just takes a little longer to get there.
The value of a ‘testing’ approach
Hopefully by now, even if you skipped right to the ‘measuring impact’ section, you’re noticing the recurring theme of approaching SEO with a testing mind-set. You don’t necessarily need to calculate sample sizes or build out a statistical significance model to determine whether a particular effort was successful, but you WILL earn respect internally if you do take these steps, and there are free tools out there for each.
One element we’ve found the most success with though, in terms of presenting the impact a particular SEO project has had: setting up a separate control group. This enables the measurement of impact not just against the trendline of the pages being worked on as part of the SEO initiative, but also helps draw attention to external factors that are outside of the scope or control of the project.
This separate test group doesn’t necessarily need to be set up in advance, but it’s more effective to do so because it will also help inform which pages should be worked on. So you might select 50 pages as similar to one another as possible in terms of metrics that are important to your test (number of ranking keywords; average rank; average organic traffic, similar backlink profiles, etc.), and then separate the pages into two different groups:
- the “A” group will be the group of pages you’re going to implement changes for; and
- the “B” group becomes your control group. The B group does not receive any SEO changes.
The other thing to keep in mind is locking these pages out of separate initiatives (both the test and control groups), such as the pages getting a content refresh or having a number of technical elements addressed.
Our ability to correlate the changes we’ve made to the impact we’re seeing, relies on separate test and control groups as well as isolating any changes to just a single initiative.
In the absence of the control group we won’t know if the impact is just to our pages or affecting a larger group (like what we might find from a core algorithm update); and when a number of changes are made to the same page(s), we then won’t know what change caused the impact in the first place.
Setting up an effective A/B test
Essentially this gives us 4 elements to consider when getting ready for our new SEO initiative:
- choosing the pages eligible for the project and determining what metrics you’ll use in your testing, to also use those metrics in selecting your pages;
- separating them into two groups of pages that are similar to each other in as many ways as possible (based on the metrics chosen), with the A group receiving the changes and the B group not receiving the changes
- Boiling your test down to a single change (earning a certain number of backlinks to close the gap relative to your top competitors might be a single test; a completely different test might be updating title tags across a large set of pages; a 3rd test might be changing CTAs to better align with search intent to improve conversion rate);
- Using 3rd party sample size and statistical significance calculators to help determine the number of pages needed for an effective test; how long the test needs to run; and whether the outcome of the test was statistically significant (these are more optional, but highly recommended).
Just having this sort of structure in place in and of itself will earn trust in your efforts and approach, and give you confidence when presenting the impact of the work.
Asking for feedback from the start
This one can be a bit of a challenge and I fully recognize multiple perspectives. One the one hand, asking for feedback at all before you start could potentially derail your entire plan; on the other hand, asking for very specific feedback (exclusive to individual elements of the tests such as the most important site sections to focus on) can earn you trust and buy-in from key stakeholders and give you an opportunity to reiterate the testing approach you’ll be taking.
Several years ago, a multi-year test was run amongst a group of banking customers. Each customer in the A group was asked for feedback on their banking experience with the company, while a separate B control group was not asked this question. Over the ensuing years, the A group was twice as likely to maintain their accounts with this bank, compared to the control group. Even though the bank didn’t intentionally implement a single suggestion that came back on the survey responses.
The take-away wasn’t ‘ignore your customer feedback in order to double your profits’; it was that asking for feedback can increase trust in a relationship, even if no changes are implemented.
Considerations for asking for upfront feedback:
- Presenting and getting sign-off on the structure of the test and incorporating the feedback or at least having it to reference, can help put the focus on whether the test was successful, and help avoid ‘the blame game’ about whether you specifically were successful or not.
- Aligning the final output of the impact reported with solving your stakeholder’s ‘central question’ means they are going to be much more invested in facilitating a successful test (regardless of the outcome of the test). This can be very helpful when something is needed from less-invested teams, such as a technical structure change from TechOps or a code change from non SEO-assigned developers.
- Even if no changes were made to your test or how you’re reporting on it, asking for initial feedback will help get alignment with your stakeholders in terms of the metrics you use to present impact; what a positive outcome of the test will look like; and depending on the impact, what the outcome of the test will be. This is particularly important any time you’re doing a ‘proof of concept’ test where the actionable takeaways may be somewhat ambiguous.
Final thoughts on demonstrating impact to stakeholders
This has been a wide-reaching article.
We’ve focused on topics related to an SEO’s ability to prepare for, accurately measure, and effectively present findings on delivering link-building impact (or any other type of SEO initiative).
The recipient/audience might be your internal stakeholder, your boss, your client, or even internal updates to broader teams.
And doing so in a way that supports your professional growth and aligns to their initiatives and priorities as well.
We’ve provided tips that hopefully will take some of the guess-work out of impact reporting and have offered guidance on a number of areas we hope will serve as a framework to help make your:
- Impact reporting easier to prep for
- Outcomes easier to capture and more effective to measure
- Analysis more on-point and aligned with your target audience
- Presentation more successful in
- earning trust with stakeholders
- getting sign-off on future projects
- earning or keeping your seat at the decision-making table
And I’d like to know how I did! Please @ me on Twitter (@jameswirth) or send me an email (james@citationlabs.com) with any feedback.
And thank you for reading!
Resources for Further Exploration
Effectively measuring and presenting your link-building results is essential to demonstrate impact. Here are resources to help you along the way:
- ROI Google Sheet Template: Simplify your link-building reporting with this ready-to-use spreadsheet. Access it here.
- Link Launch Tool: Streamline your campaigns to achieve measurable results with this powerful tool. Try it here.
- Learn More: Explore advanced strategies for measuring and optimizing your link-building efforts. Learn more here.