Marketers and SEOs debate whether they can track AI visibility because AI answers are probabilistic.
Teams see variance in prompt responses and assume measurement won’t hold up.
But there is a difference between testing single-run rank on AI prompt responses with a small data set and testing at scale across entire cohorts numerous times (something we do with clients using Xofu).
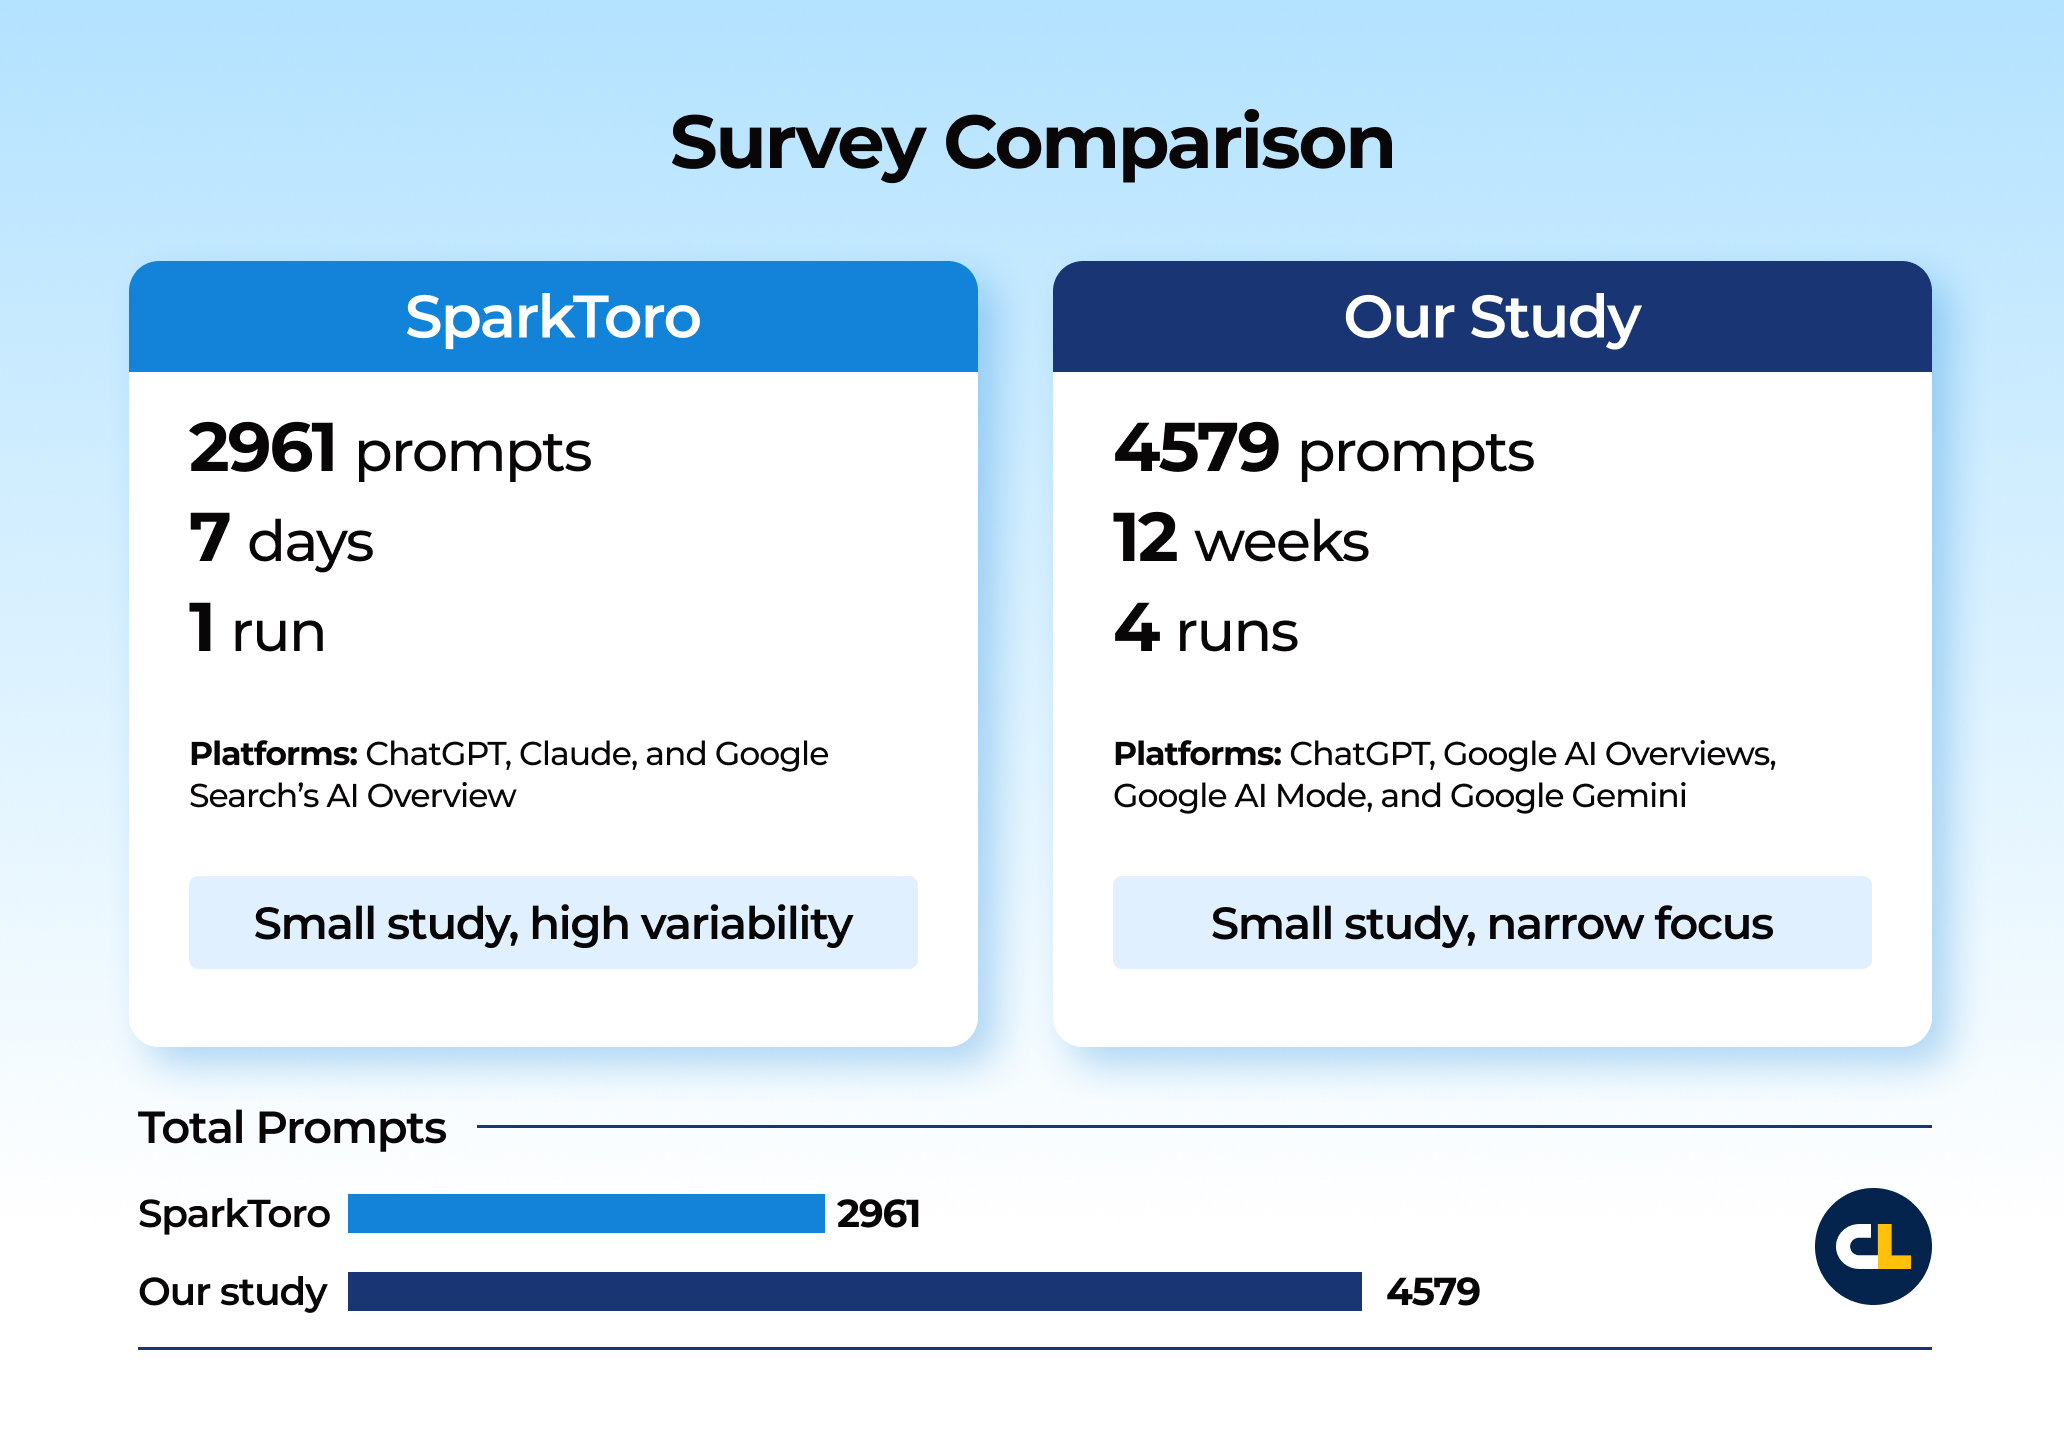
Recently, we tracked 4,579 prompts over 12 weeks with a single client. Our findings show that while single run rank has limited to no value, Presence Rate and Recommendation Rank across repeat runs show what sticks.
You need to run the same purchase-intent prompts on a set schedule. Track how often your brand appears and where it ranks on ordered lists in AI answers. And compare that to competitors.
That visibility percentage across numerous prompts works as a proxy for how brands show up in real AI answers—whether the prompts come from humans or from synthetic generation.
Recommendation Rank: What You Can Measure in AI Answers
People see variance in AI outputs and jump to the conclusion that “measurement doesn’t work.”
Recent reports seem to support that conclusion. For example, SparkToro’s volunteer study analyzed 2,961 runs on 12 prompts from 600 volunteers in ChatGPT, Claude, and Google’s AI surfaces.
Their conclusion?
Ordered list recommendations were almost never repeated in the same order.
So…that’s it. Tracking rank in AI is a “fool’s errand”.
This was Rand’s initial position before running the research, but he did come back around (at least partially) by the end of his article.
Source: SparkToro and Gumshoe, 27 January 2026
Or is it?
The data support one clear takeaway: a single run list position won’t hold up as a metric. That aligns with what we’ve seen in our work tracking our client’s visibility in LLMs.
But stating “AIs are probabilistic and therefore are too random to track” is the wrong conclusion.
Instead, you need to track a much larger dataset across numerous platforms, numerous times to gain meaningful insights. (Something the report notes as well, with Rand suggesting 60-100x as the baseline).
Variance kills single-run rank as a KPI. But it doesn’t kill Presence Rate when you aggregate across prompt clusters and repeat runs.
We’d go one step further and state that you need to track AI rank in prompts over a longer period of time (think months and quarters, not days or instances).
This gives you better insights.
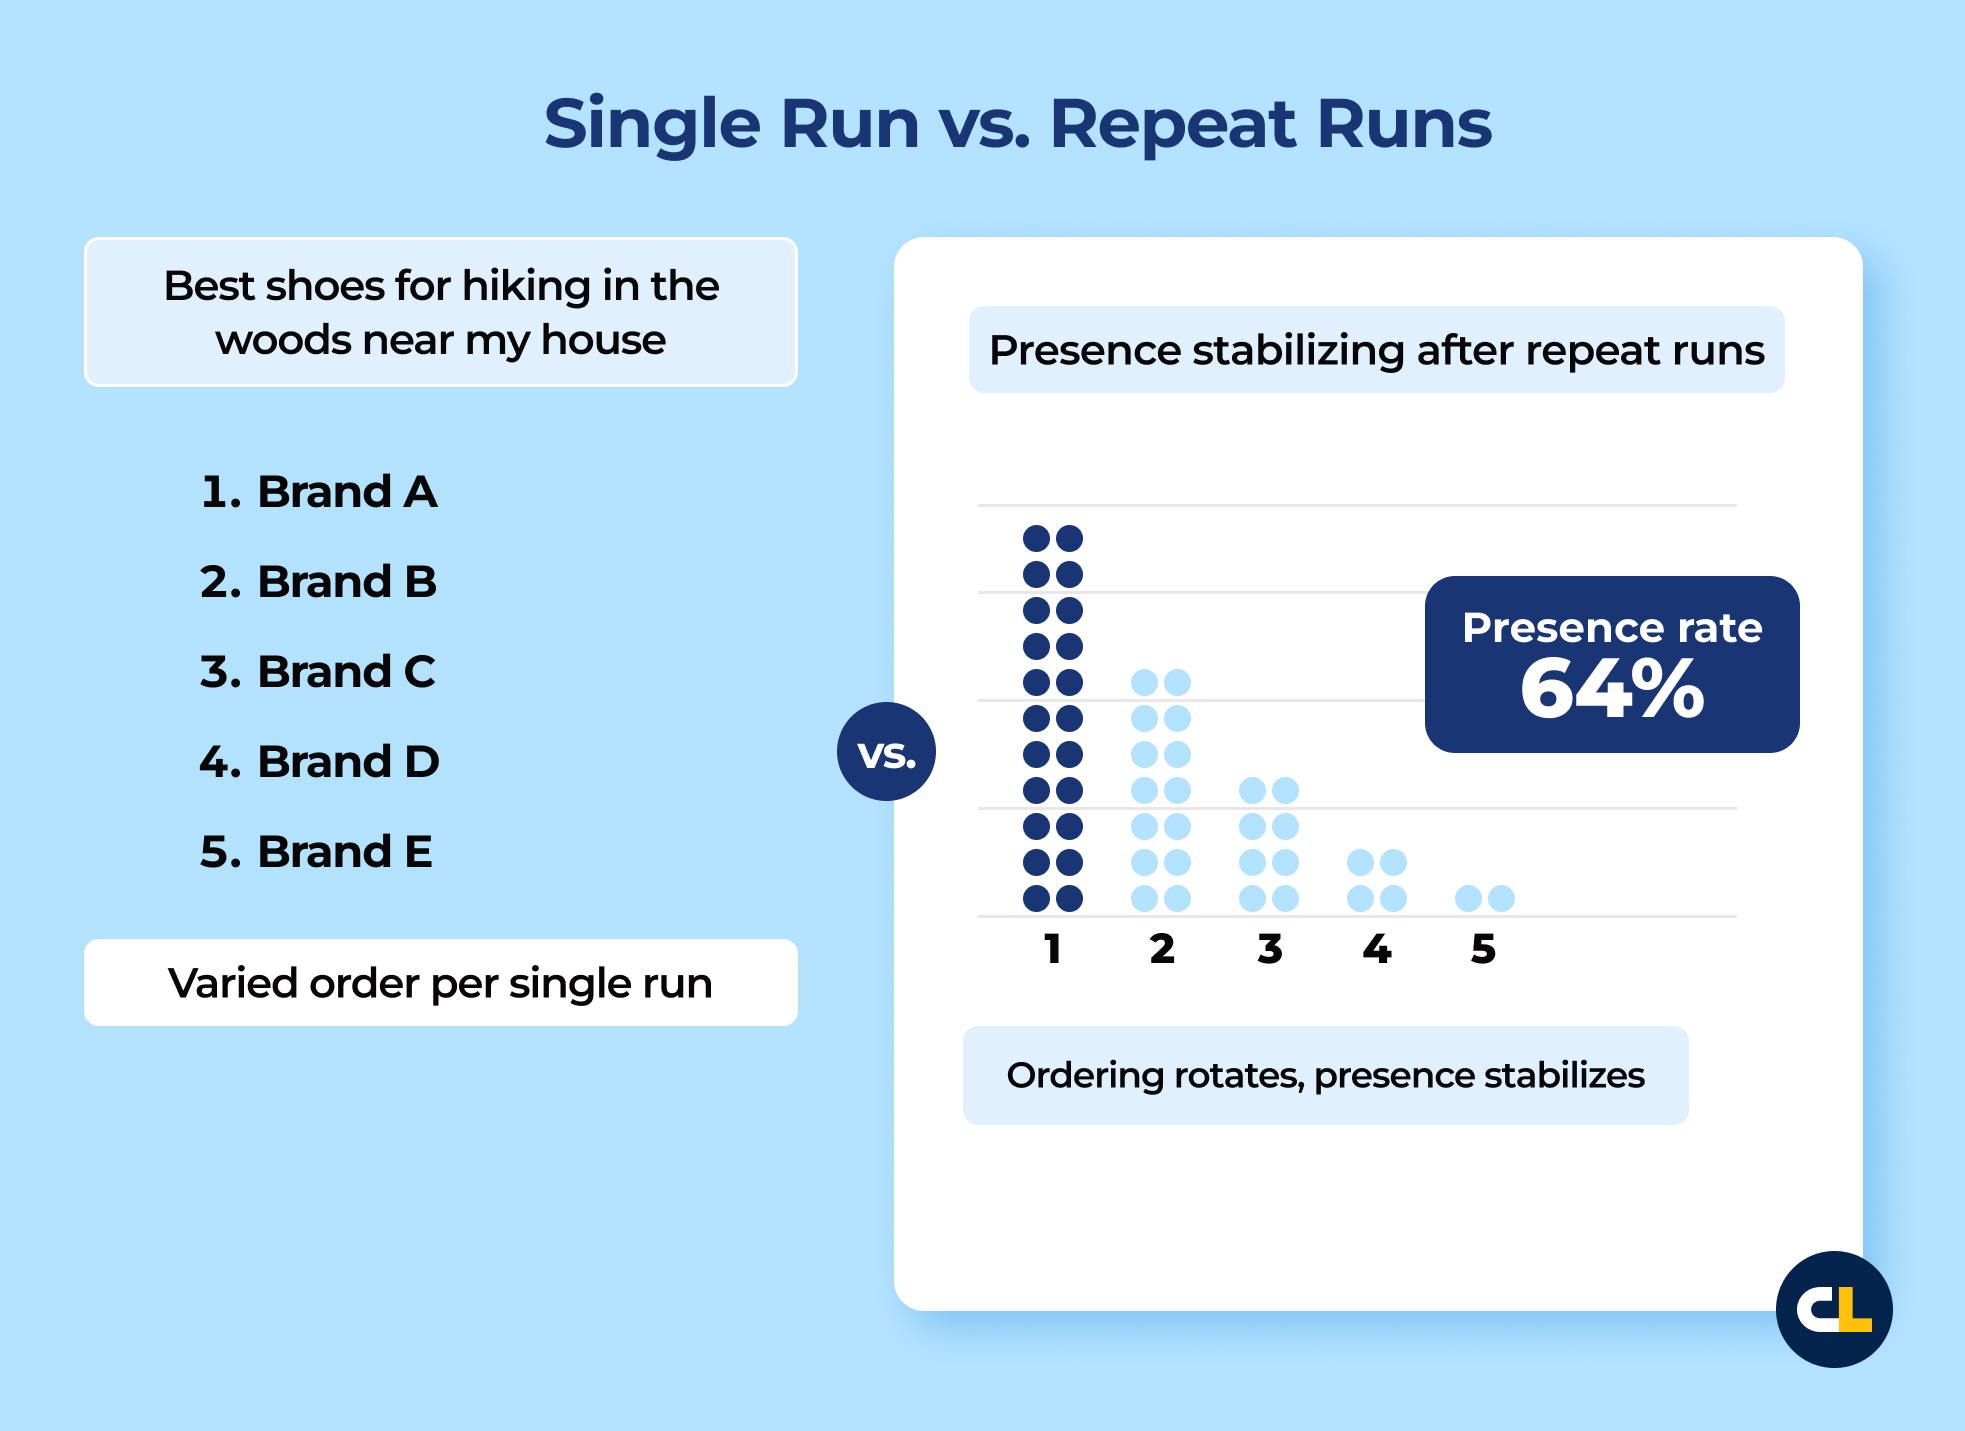
Even when the ordering changes, certain brands and entities reappear across runs. The report calls this “visibility percent” (we refer to it as Presence Rate) and describes it as reasonable when measured across 60-100 repeated runs and averaging the results.
That’s the right unit of measurement: frequency of appearance across a defined cohort (not a slot on a single output).
When prompts ask for ordered lists, you can go one step further. Track inclusion (did you appear) and position as a distribution across repeat prompts over time.
The top three inclusions, median positions, and overall spread will tell you what’s stable and what’s noise.
Citation Labs does this at scale with Xofu. We build BOFU prompt cohorts from buyer intent and competitor framing, run them on a fixed cadence, and aggregate the results across repeats.
Presence Rate becomes the baseline. Ordered list prompts add Recommendation Rank* distributions you can report week to week.
*Recommendation Rank: how often and how high a brand is recommended when buyers ask AI to compare or suggest options for a specific purchase problem.
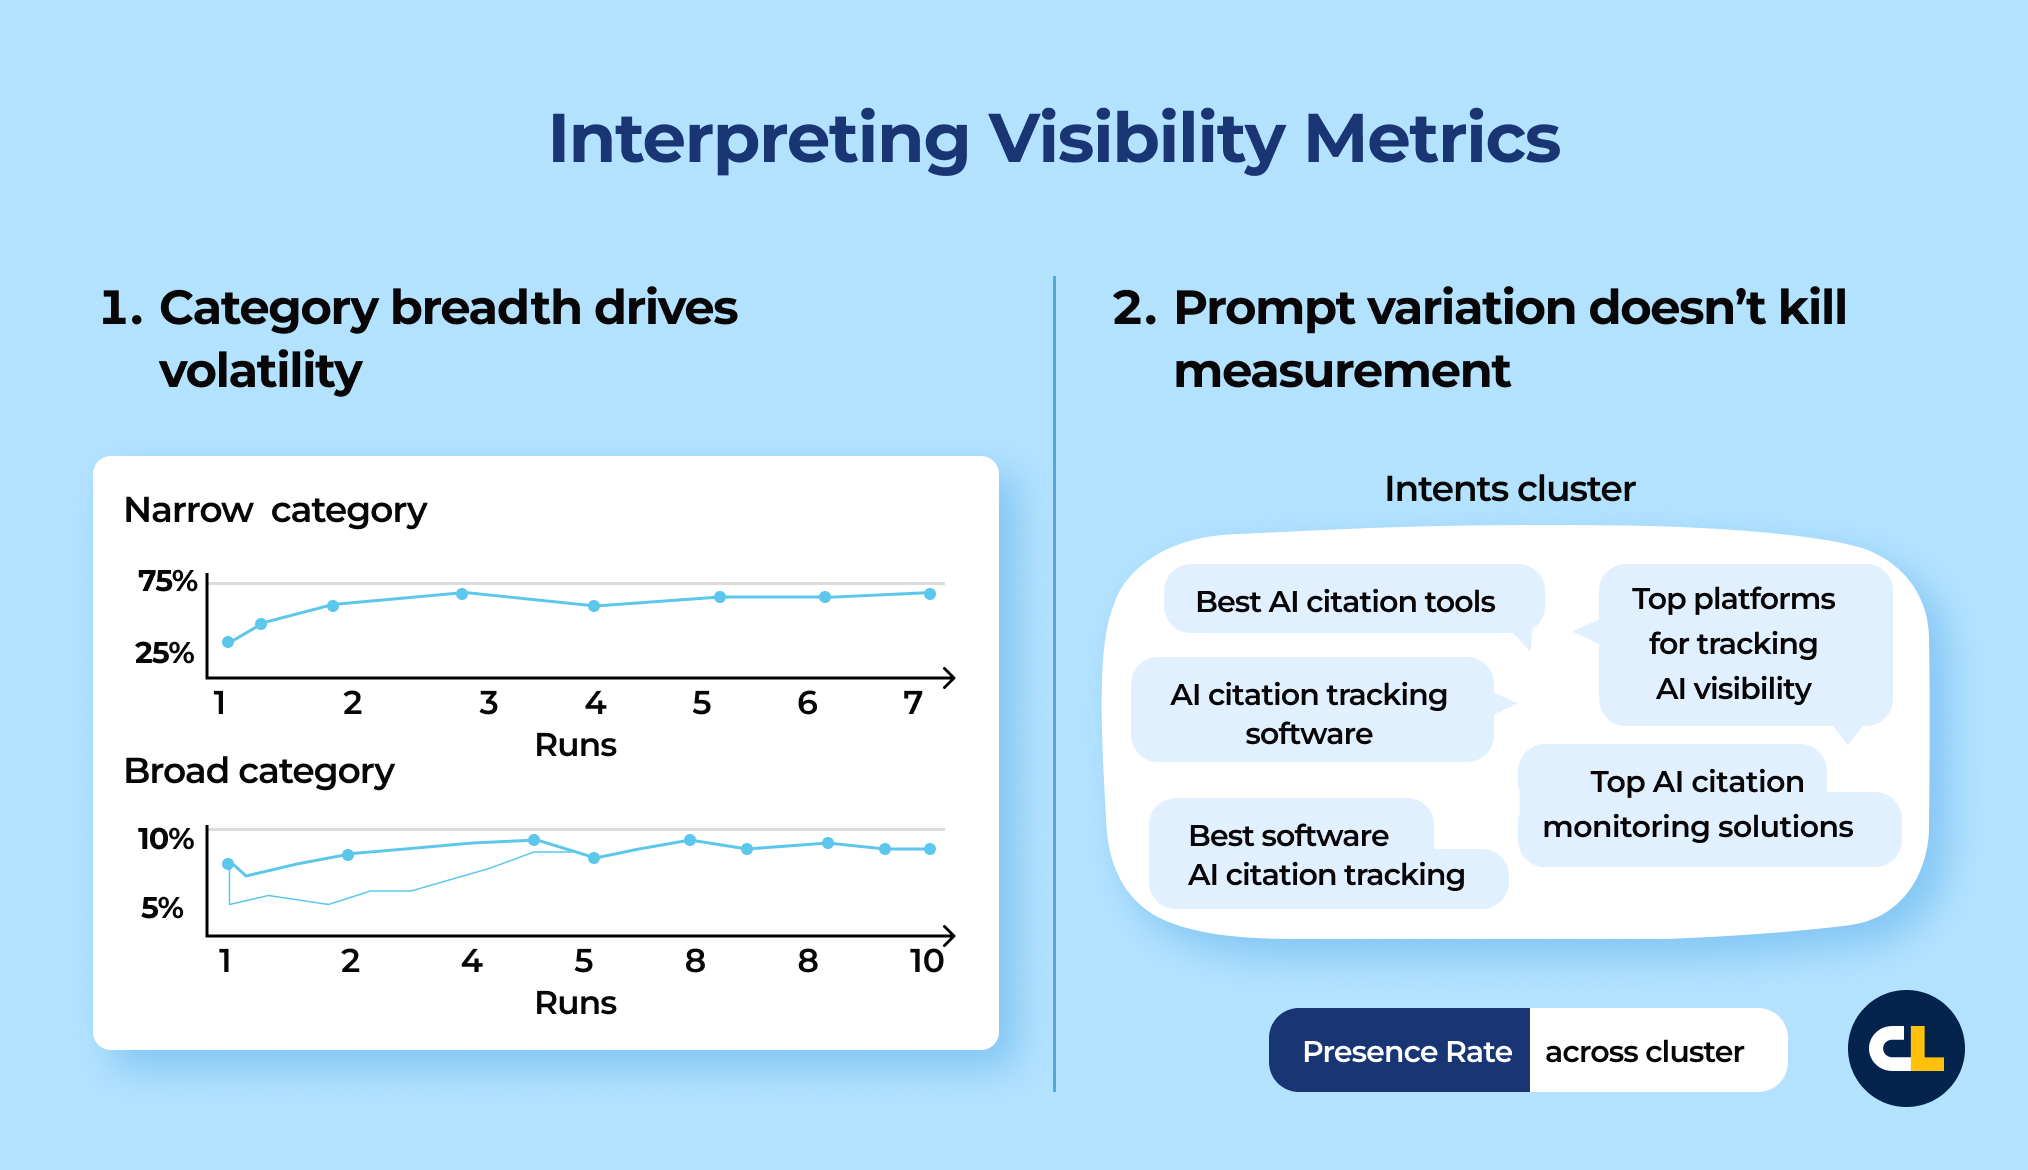
Two conditions shape how you interpret any visibility metric:
- Category breadth drives volatility. Broad categories require larger cohorts and more repeats before Presence Rates stabilize. Narrow categories settle faster. Treat breadth as a sampling requirement.
- Prompt variation doesn’t kill measurement. Don’t treat phrasing changes as a reason to throw out synthetic prompts. Build prompt clusters that model an audience’s solutioning approach to the problem space, then measure brand appearance frequency across the cluster.
In summary, measure Presence Rate across prompt clusters and repeat runs. When prompts request ordered lists, report Recommendation Rank as a distribution.
Use those baselines to judge whether changes in your source footprint and content move what models cite and recommend.
Three Mistakes That Make AI Visibility Metrics Useless
While you can measure AI visibility, you can also manufacture progress by accident. When reporting on AI visibility, you want to avoid these shortcuts that damage trust fast.
1. Single run “rank” creates a fake KPI
A single output can’t support a KPI that implies stability. If you report rank, report how it behaves across repeated runs over time (not a single output or even a small handful of outputs).
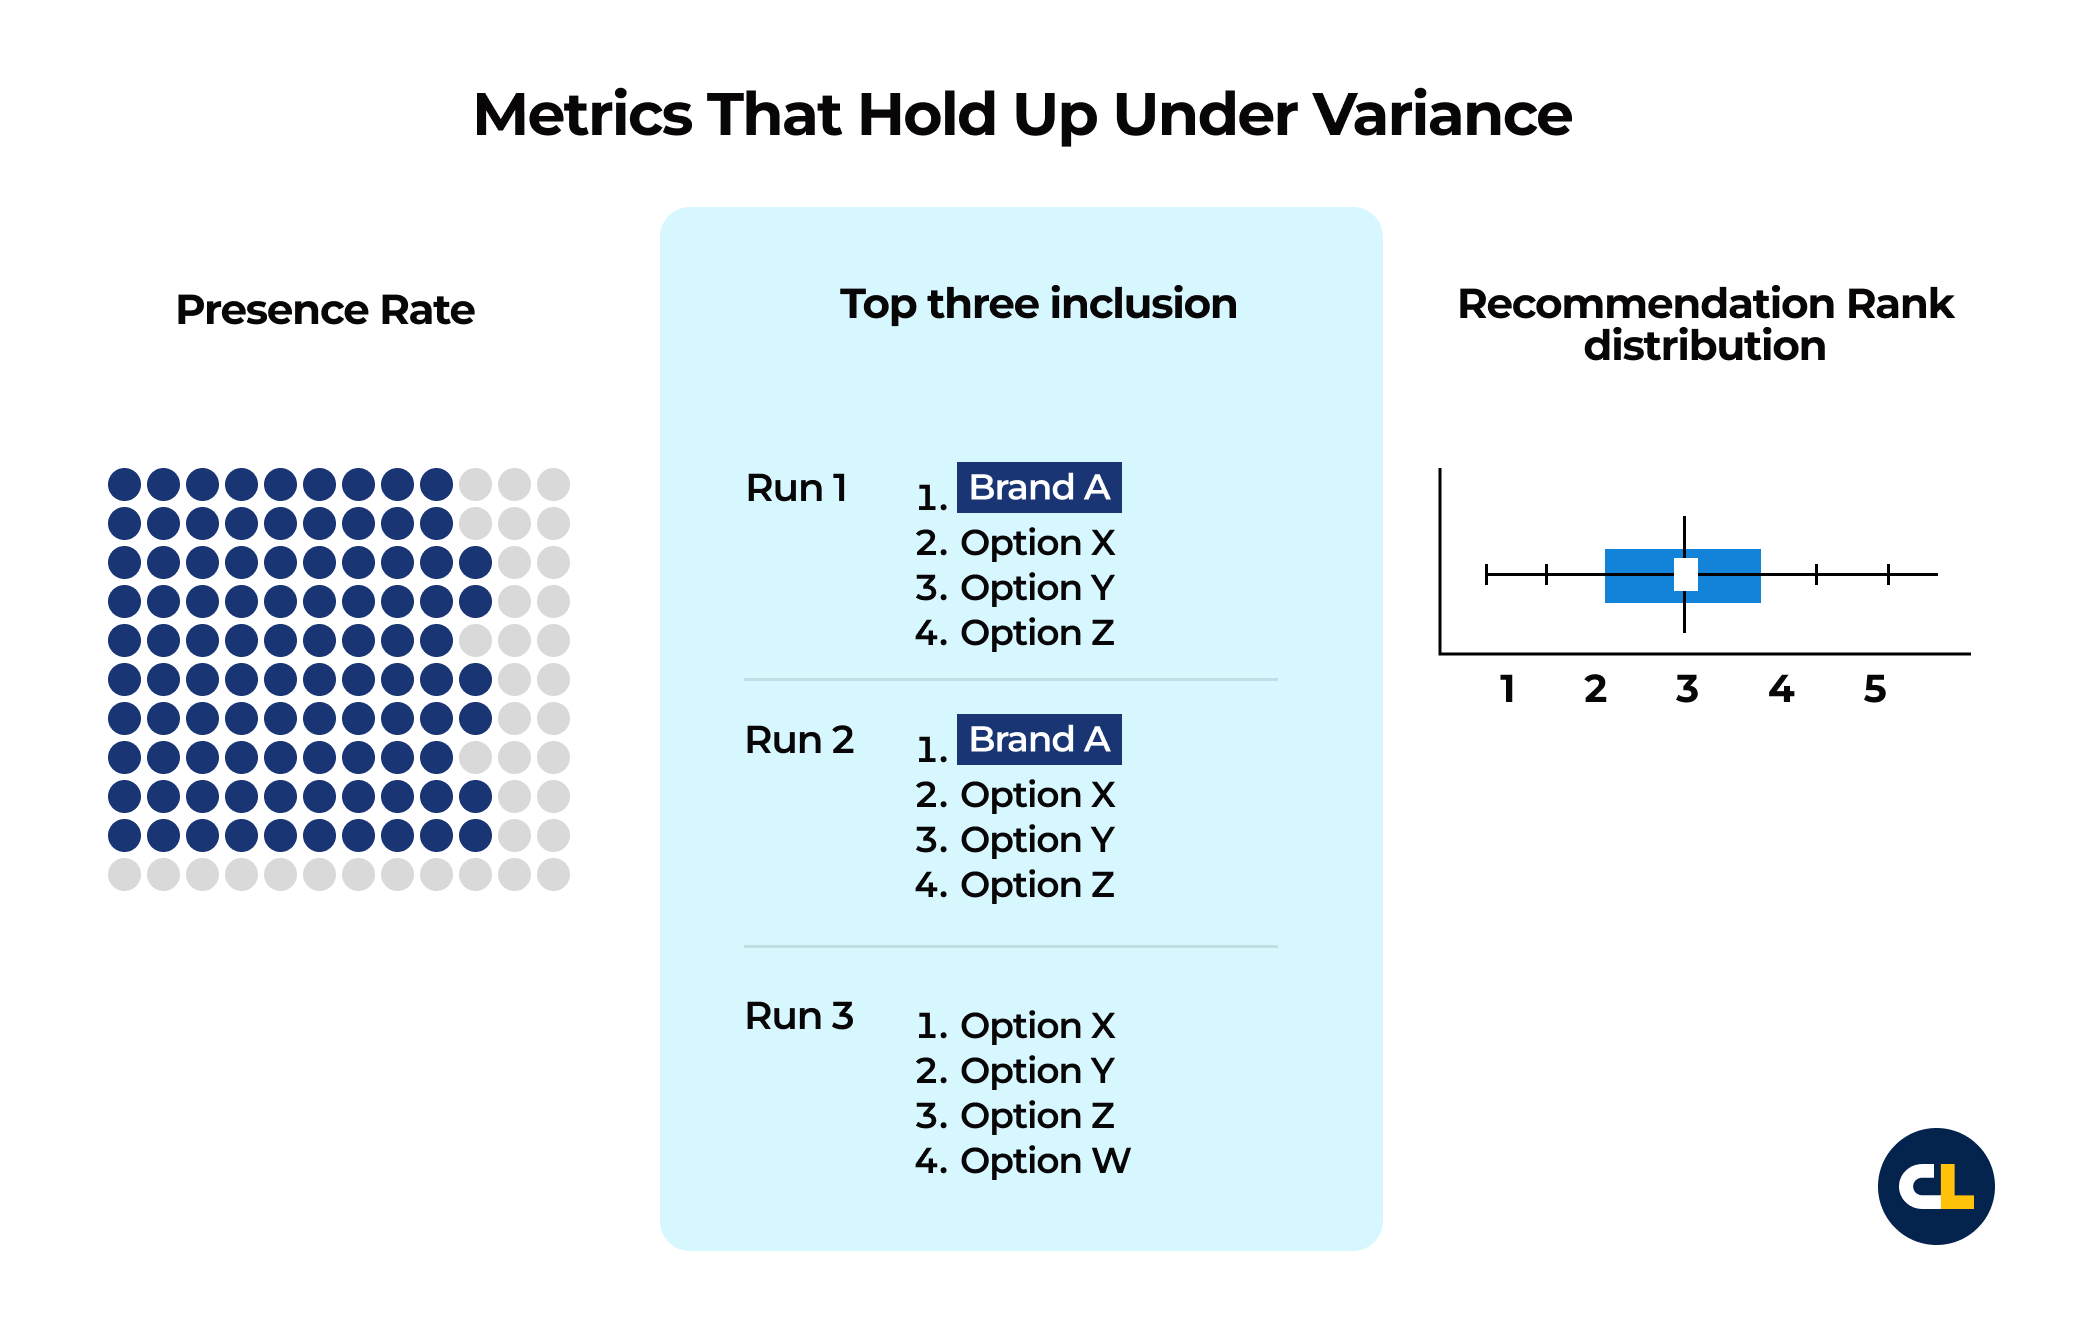
Metrics that hold up under variance
- Presence Rate: how often the brand appears across repeat runs for the same intent cohort
- Top three inclusion: how often the brand shows up in the top three when the prompt asks for an ordered list
- Recommendation Rank distribution: median position plus percentiles across repeat runs
2. Repeats reduce noise, but cohorts decide the story
Repeated runs reduce variance, while cohort selection introduces bias.
Once you report “visibility across prompts,” prompt selection becomes the easiest lever to pull when leadership asks for proof.
Teams tweak prompts until the chart improves, then treat it as a performance metric—even when everyone acts in good faith.
A defensible program uses simple rules:
- Define cohorts from buyer intent, not from whatever the model outputs today
- Lock the cohort before any campaign work starts, then track it through the full window
- Log changes.*
*Governance rule: if you change more than 10% of prompts, treat it as a new cohort. If you change the required response format, treat it as a new cohort
3. Secondary KPIs can support the story (but they can’t prove it)
Teams reach for proxies to avoid baseline work. Two show up the most:
- Sentiment: Prompt format, model voice, and answer structure swing adjectives hard. Without a rubric and consistent scoring, it’s easy to misinterpret things like audience to offering mismatch.
Note: If an AI says, “Brand X is incredibly powerful but too expensive for startups,” we log a low Qualified Fit (Q-FIT) score due to budget constraints. True “warnings” indeed exist, but we log those as a Risk Warning (X-WARN).
- Branded lift: branded search and direct traffic can rise with AI visibility, but too many other forces move in the same lines: seasonality, paid spend, PR, email volume, launches, and competitive moves. Without controls, you can’t assign credit.
Keep primary proof close to the interaction:
- Inclusion rate across intent cohorts and repeated runs
- Source or citation footprint where the surface exposes it, with quality checks
- Accuracy on nonnegotiables where the answer makes claims you can verify
- Downstream conversions where attribution holds up
Remember: Use sentiment and branded demand as support (not proof).
Our Findings: Tracking 4,579 Prompts over 12 Weeks for 1 Client
If you want trustworthy AI recommendation data, you can’t judge a single output. You need to ask the same prompts many times and average the results.
With enough data, you’ll get a Visibility percent across lots of prompts that works as a proxy for how brands show up in real AI answers.
We did that at scale for one B2B enterprise client.
We ran 4 runs over 12 weeks for one client across ChatGPT, Google AI Overviews, Google AI Mode, and Google Gemini—grouping 4579 prompts into 458 BOFU cohorts and averaging results across the four runs.
Ordering and cited URLs rotated run to run, but Presence Rates stabilized within the project. The model returned a table in 57.6% of runs and included the client’s brand in the table 64.5% of the time.
Across the project, the client appeared in the answer 65.0%* of runs. That distribution gave us a baseline we could compare week to week while we shipped content and off-site changes.
*Average across the 4 runs/12 weeks.
Brand Mention Percentage Tracking Results (12 Week Runs)
| Period | Google AI Mode | Google AI Overview | Google Gemini | GPT 4o | GPT 5 Mini |
|---|---|---|---|---|---|
| November 2025 | 73.83% | 7.85% | 74.76% | 39.38% | 99.48% |
| December 2025 | 90.08% | 29.41% | 73.76% | 40.42% | 99.56% |
| January 2026 | 89.28% | 54.40% | —* | 38.13% | 99.30% |
| OverallM | 83.16% | 25.33% | 74.43% | 39.33% | 99.45% |
*Gemini January run failed
Takeaways
- Presence Rate stabilizes even when ordering churns, so distribution tracking beats single-run ranking.
- Surface behavior diverges sharply, so measure visibility per surface and report it that way.
- Cohorts make the signal usable. Aggregation turns prompt-level noise into something you can compare over time.
Note: All prompts for this project start by instructing the LLM to create a comparative matrix of solutions.
A Measurement Model That Survives the Boardroom
Leadership does not need any more SEO dashboards.
They need a repeatable way to sample AI answers, evidence that anyone can check, and a clear link between what changed and why the numbers moved.
This is how you measure AI visibility:
1. Group prompts by how buyers decide
Do not just track “Best CRM.”
Build tracking-worthy BOFU cohorts that force the LLM to make explicit trade-offs and group them by the Decision Constraint:
- Buyer role (who asks)
- Constraint (budget, skill-level, urgency)
- Buying stage (why they ask)
- Response format (list, comparison, best for X)
Run the same prompt groups on a fixed schedule and track Presence Rate inside each group.
Output: prompt group definitions plus a baseline report per group.
2. Save proof for every run
For each run, save the prompt and the full response, then tag the result and average the metrics across repeats:
- Mentioned or not mentioned
- Recommended/warned
- Brand position within the response
- Citations when the surface shows them
Output: a run log that backs every chart with evidence.
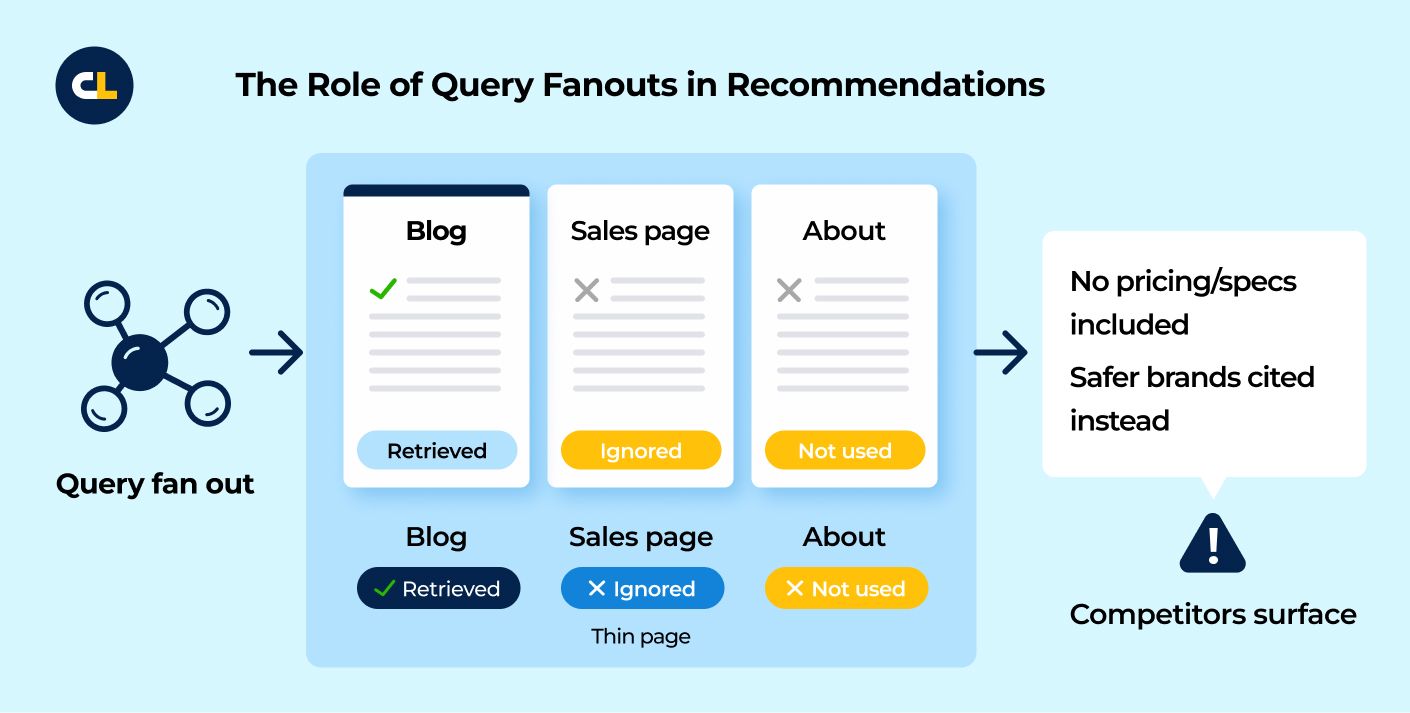
3. Track which sites drive the result
When the surface shows citations, roll them up and watch the mix change:
- Which domains/pages show up repeatedly:
- Owned Assets (your docs/blogs/socials)
- Earned Assets (Digital PR/sponsorships)
- Third Parties (comparison sites, other in-market publishers)?
If one or two sources account for most appearances, you rely on a small base. If the mix widens, you reduce fragility.
Output: a source report that explains why visibility rises or falls—and where to go to defend or improve your visibility and standing.
4. Audit Along the “Decision Axis”
Pick a short list of details that buyers use to disqualify vendors and check them inside purchase-ready prompt groups:
- Pricing claims
- Eligibility and fit
- Core differentiators
Your brand can show up and still lose if your on/off-site citations omit or misinform the criteria or “column headers” (e.g., SOC2 Compliance, Total Cost of Ownership, Trustworthiness), the AI used to steer your audience toward the least risky decision.
Output: an accuracy audit report with the claim, the evidence, the verdict, and the fix.
NOTE: You must also audit how the AI sees your content. Cloudflare shipped Markdown for Agents, which serves a Markdown version of a page when a client requests text/markdown via content negotiation. That creates two views of the same page: one for humans and one for agents. If your competitor’s agent view carries a clearer, lighter argument than yours, agents can ingest more of their decision logic and truncate yours.
Audit your assets for Markdown Parity. Ensure your comparison tables and decision logic survive the conversion to text-only formats so agents can read them without the “packaging.”
Output: An accuracy audit report with the claim, the evidence, the technical readability score, and the fix.
What Breaks Once You Start Measuring AI Visibility
Teams dismiss AI visibility measurement because outputs vary. That logic applies mainly to single-run rank and small datasets.
Once you measure across fixed prompt groups and repeat runs, probability becomes a distribution you can track.
Presence Rate shows how often you appear.
Publish clear, consistent facts across owned pages and credible third-party sources so retrieval pulls consistent inclusion patterns across runs.
That holds up because you’re sampling behavior—not defending a single screenshot.
Measurement also strips out the loopholes.
Lock prompt groups and log changes so the numbers reflect performance. Publish clear, consistent facts across owned pages and credible third-party sources so retrieval pulls the same answer across runs. Audit details because a brand can show up and still lose when the model gets pricing, fit, or capabilities wrong.
This gives you a repeatable system for tracking AI visibility.
Measure Presence Rate and Recommendation Rank distributions across buying prompt groups, then change the sources and content that drive what models retrieve and cite.